How to change the plotting backend
optimagic supports various visualization libraries as plotting backends, which can be
selected using the backend argument. In the following guide, we showcase the
criterion_plot visualized using different backends.
import numpy as np

import optimagic as om


def sphere(x):
    return x @ x


results = {}
for algo in ["scipy_lbfgsb", "scipy_neldermead"]:
    results[algo] = om.minimize(sphere, params=np.arange(5), algorithm=algo)
Backends
Plotly
The default plotting library. To select the Plotly backend explicitly, set backend="plotly".
The returned figure object is a plotly.graph_objects.Figure.
Note
Choose the Plotly renderer according to your environment:
Use
plotly.io.renderers.default = "notebook_connected"in Jupyter notebooks for interactive plots.Use
plotly.io.renderers.default = "browser"to open plots in your default web browser when running as a script.
Refer to the Plotly documentation for more details.
import plotly.io as pio

pio.renderers.default = "notebook_connected"

fig = om.criterion_plot(results, backend="plotly")  # Also the default
fig.show()
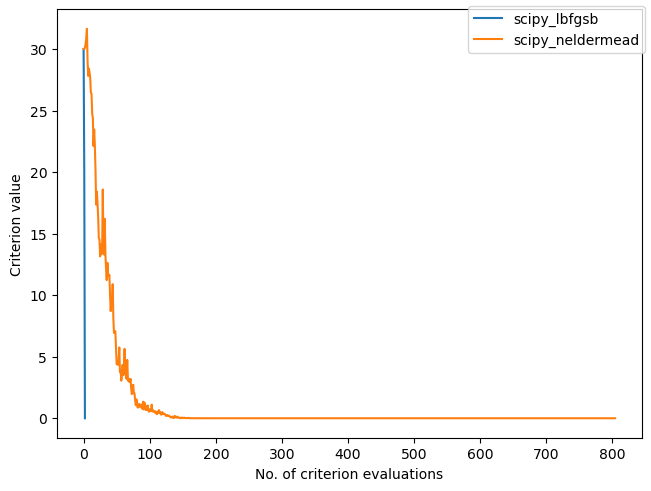
Matplotlib
To select the Matplotlib backend, set backend="matplotlib".
The returned figure object is a matplotlib.axes.Axes.
In case of grid plots (such as convergence_plot or slice_plot), the returned object is a 2-dimensional numpy array of Axes objects: numpy.ndarray[matplotlib.axes.Axes] of shape (n_rows, n_cols).
ax = om.criterion_plot(results, backend="matplotlib")
Bokeh
To select the Bokeh backend, set backend="bokeh".
The returned figure object is a bokeh.plotting.figure.
In case of grid plots (such as convergence_plot or slice_plot), the returned object is a bokeh.models.GridPlot object.
Warning
Bokeh applies themes globally. Passing the
templateparameter to a plotting function updates the theme for all existing and future Bokeh plots. If you do not passtemplate, a default template is applied, which will also change the global theme.Bokeh doesn’t support titles for grid plots. So, the
titleparameter inslice_plotis ignored when using the Bokeh backend.
Altair
To select the Altair backend, set backend="altair".
The returned figure object is an altair.Chart.
In case of grid plots (such as convergence_plot or slice_plot), the returned object is either an altair.Chart if there is only one subplot, an altair.HConcatChart if there is only one row, or an altair.VConcatChart otherwise.
Warning
Altair applies themes globally. Passing the template parameter to a plotting function updates the theme for all existing and future Altair plots. If you do not pass template, a default template is applied, which will also change the global theme.
Note
It is mostly not required to set the renderer manually, as Altair automatically selects the appropriate renderer based on your environment. In this example, we explicitly set the renderer to ensure correct display within the documentation.
Refer to the Altair documentation for more details.
import altair as alt

# Setting the renderer is mostly not required. See note above.
alt.renderers.enable("jupyter")

chart = om.criterion_plot(results, backend="altair")
chart.show()
Customizing plots
Here, we provide a simple example of how to customize plots created with different backends.
fig = om.criterion_plot(results, backend="plotly")

# Configure Axes
fig.update_yaxes(title_text="Custom Y Label", title_font_size=20)
fig.update_xaxes(range=[0, 100])

# Change legend position
fig.update_layout(legend=dict(xanchor="left", yanchor="top", x=1, y=0.6))

# Configure line properties
# The index corresponding to a line, can be inferred from the legend
# In case of criterion_plot, it is the order of optimizers in `results`
fig.data[0].update(line=dict(width=4))
fig.data[1].update(line=dict(dash="dashdot"))

fig.show()
ax = om.criterion_plot(results, backend="matplotlib")

# Configure Axis
ax.set_ylabel(ylabel="Custom Y Label", fontsize=20)
ax.set_xlim(0, 100)

# Change legend position
ax.figure.legends[0].set_loc("outside center right")

# Configure line properties
# The index corresponding to a line, can be inferred from the legend
# In case of criterion_plot, it is the order of optimizers in `results`
ax.lines[0].set_linewidth(4)
ax.lines[1].set_linestyle("dashdot")
from bokeh.models import Range1d

p = om.criterion_plot(results, backend="bokeh")

# Configure Axes
p.yaxis.axis_label = "Custom Y Label"
p.yaxis.axis_label_text_font_size = "20pt"
p.x_range = Range1d(0, 100)

# Change legend position
p.add_layout(p.legend[0], "right")
p.legend[0].location = "center"

# Configure line properties
# The index corresponding to a line, can be inferred from the legend
# In case of criterion_plot, it is the order of optimizers in `results`
p.renderers[0].glyph.line_width = 4
p.renderers[1].glyph.line_dash = "dashdot"

show(p)
Note
Due to the nature of Altair charts, top-level configuration may not work as expected. In these cases, it might be necessary to override the encoding.
import altair as alt

chart = om.criterion_plot(results, backend="altair")

# Configure Axes
chart = chart.encode(
    y=alt.Y("y", axis=alt.Axis(title="Custom Y Label", titleFontSize=20)),
    x=alt.X("x", scale=alt.Scale(domain=(0, 100))),
)

# Configure lines
chart = chart.encode(
    strokeWidth=alt.condition(
        alt.datum.name == "scipy_lbfgsb", alt.value(4), alt.value(2)
    ),
    strokeDash=alt.condition(
        alt.datum.name == "scipy_neldermead", alt.value([8, 4, 2, 4]), alt.value([1, 0])
    ),
)

chart.show()